18. Sequences
b2. Limits From Plots
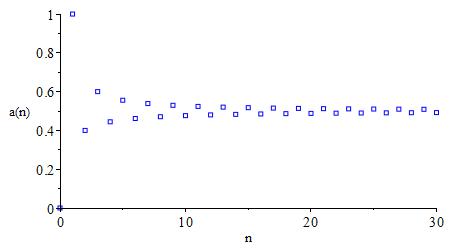
One can often use a plot to guess the limit of a sequence.
The first \(30\) terms of the sequence \(a_n=\dfrac{n}{2n+(-1)^n}\) are plotted at the right. From the plot we expect that \(\lim\limits_{n\to\infty}a_n =\lim\limits_{n\to\infty}\dfrac{n}{2n+(-1)^n} =\dfrac{1}{2}\)
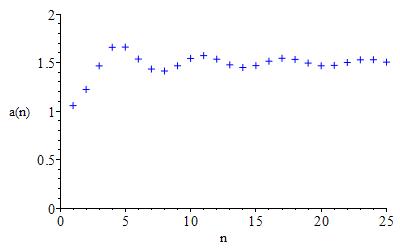
Use a plot to estimate the limit of the sequence \(a_n=\dfrac{3n}{2n+\sin n}\).
The plot of \(a_n=\dfrac{3n}{2n+\sin n}\) is shown at the right. So we expect \(\lim\limits_{n\to\infty}\dfrac{3n}{2n+\sin n} =\dfrac{3}{2}\).
A plot is not usually regarded as sufficient to show that a sequence has a limit nor to determine the value of the limit.
Heading
Placeholder text: Lorem ipsum Lorem ipsum Lorem ipsum Lorem ipsum Lorem ipsum Lorem ipsum Lorem ipsum Lorem ipsum Lorem ipsum Lorem ipsum Lorem ipsum Lorem ipsum Lorem ipsum Lorem ipsum Lorem ipsum Lorem ipsum Lorem ipsum Lorem ipsum Lorem ipsum Lorem ipsum Lorem ipsum Lorem ipsum Lorem ipsum Lorem ipsum Lorem ipsum